Will Bitcoin (BTC) Crash Again? Key Data Predicts What’s Next
Bitcoin (BTC), the world’s largest cryptocurrency by market cap appears bearish and may experience a notable price decline in the coming hours or days. On October 18, 2024, BTC hinted at a potential price correction as it formed a bearish candlestick pattern at a strong resistance level.
Bitcoin (BTC) Technical Analysis and Upcoming Levels
According to expert technical analysis, BTC is currently facing strong resistance at the upper boundary of a descending channel pattern. Since March 2024, BTC has reached this level more than six times, experiencing notable selling pressure and a price decline of over 20% each time.
However, the formation of a bearish engulfing candlestick pattern on the daily time frame suggests a similar price decline in the coming days
Besides this bearish outlook on the daily time frame, a closer look at the BTC chart on the four-hour timeframe shows that the world’s largest cryptocurrency is currently finding support at the $66,700 level. Additionally, BTC has been consolidating between $66,700 and $68,000 over the past two trading days.

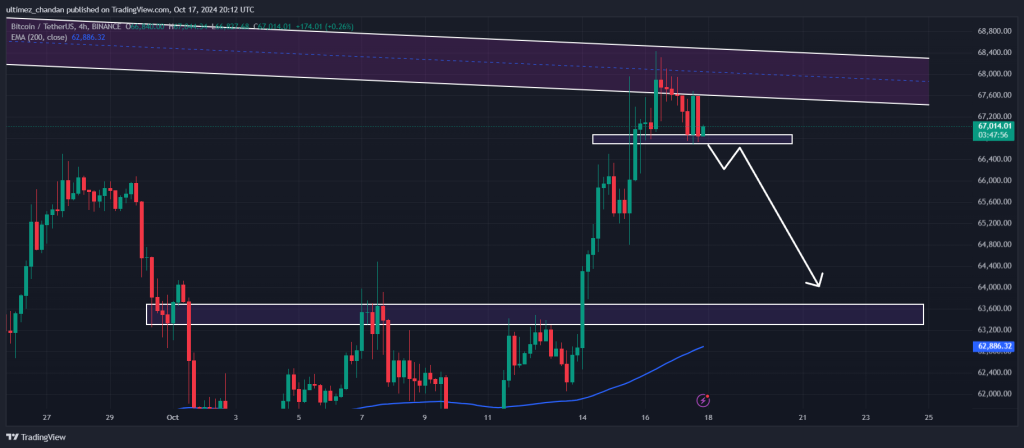
Based on the recent price momentum, if BTC breaks the lower boundary of the consolidation zone and closes a daily candle below the $66,500 level, there is a strong possibility that the asset could decline by over 6% to reach the $62,500 level.
Bearish Sentiment Confirmed by On-Chain Metrics
BTC’s negative outlook is further supported by on-chain metrics. According to the on-chain analytics firm Coinglass, BTC’s Long/Short ratio currently stands at 0.968, indicating bearish sentiment among traders. Additionally, its future open interest has dropped by 3.43% over the last 24 hours and 1.85% over the past 24 hours.
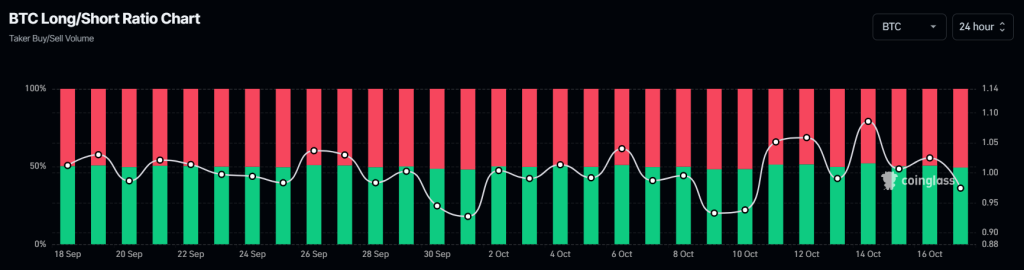
This decline in open interest suggests either the liquidation of traders’ long positions or traders exiting their positions, likely due to fear of a price crash.
Combining these on-chain metrics with the technical analysis, it appears that bears are currently dominating the asset and have the potential to trigger a massive price decline.
Current Price Momentum
At press time, BTC is trading near $66,920 and has experienced a price decline of over 1.8% in the past 24 hours. During the same period, its trading volume dropped by 21%, indicating lower participation from traders due to the current market sentiment.