BTC/USD Recovers Above $63,000 Level
Bitcoin Price Prediction – October 25
The Bitcoin price prediction is up by more than 4.54% as the price struck a sudden and bullish price spike above the moving averages.
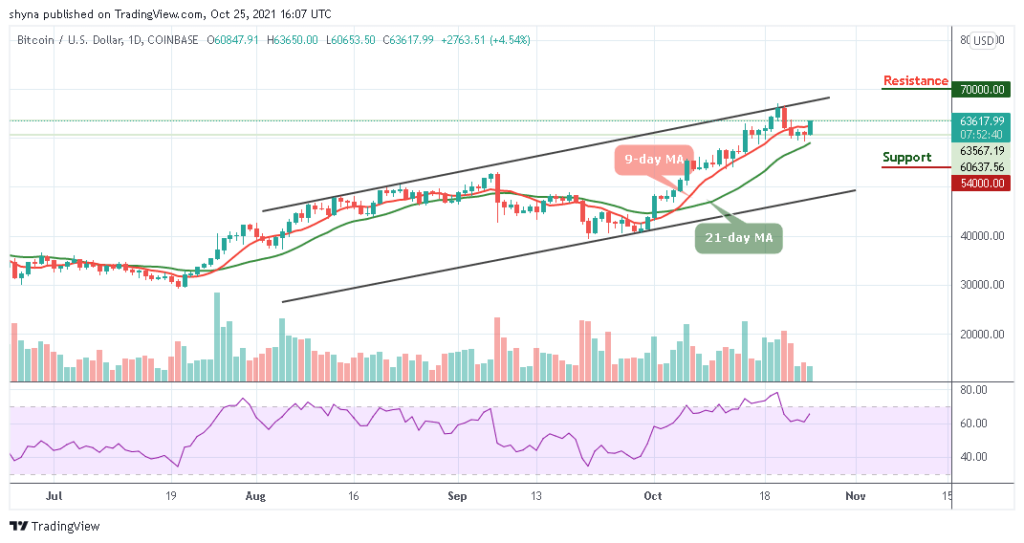
BTC/USD Long-term Trend: Bullish (Daily Chart)
Key levels:
Resistance Levels: $70,000, $72,000, $74,000

Support Levels: $54,000, $52,000, $50,000
The daily chart reveals that BTC/USD is pushing the price above the crucial resistance level of $63,000 as the coin keeps moving towards the $65,000 resistance level. However, the number-one crypto is moving with strong bullish momentum after a sustainable break above the 9-day moving average. Meanwhile, BTC/USD has gained over 4% since the beginning of the day as it is currently trading at $63,617.
Bitcoin Price Prediction: Bitcoin (BTC) May Eye $65,000
As the Bitcoin price stays above the 9-day and 21-day moving averages, the return below $60,000 could set the coin for gains towards $65,000. Meanwhile, the technical analysis shows that the bulls are ready for action especially when the Relative Strength Index (14) is considered. Therefore, any further bullish movement towards the upper boundary of the channel could pave the way for gains above $58,500 before reaching the resistance levels of $70,000, $72,000, and 74,000.
Looking at the downside, if the price falls back below the 21-day moving average and move to cross below the lower boundary of the channel, the bears may wrestle out control over the situation very quickly. This may likely serve as a major blow for the market sentiments as traders could interpret it as a sign of underlying weakness. The next critical support may come at $55,000, which may be followed by $54,000, $52,000, and $50,000 support levels.

BTC/USD Medium – Term Trend: Bullish (4H Chart)
The 4-hour chart reveals that the market is moving above the 9-day and 21-day moving averages. However, the intraday trading is looking bullish; following the recent rebound at $63,000 which is the key support level. If the coin trades below the moving averages, it could meet the next key support level at $61,000 and below.
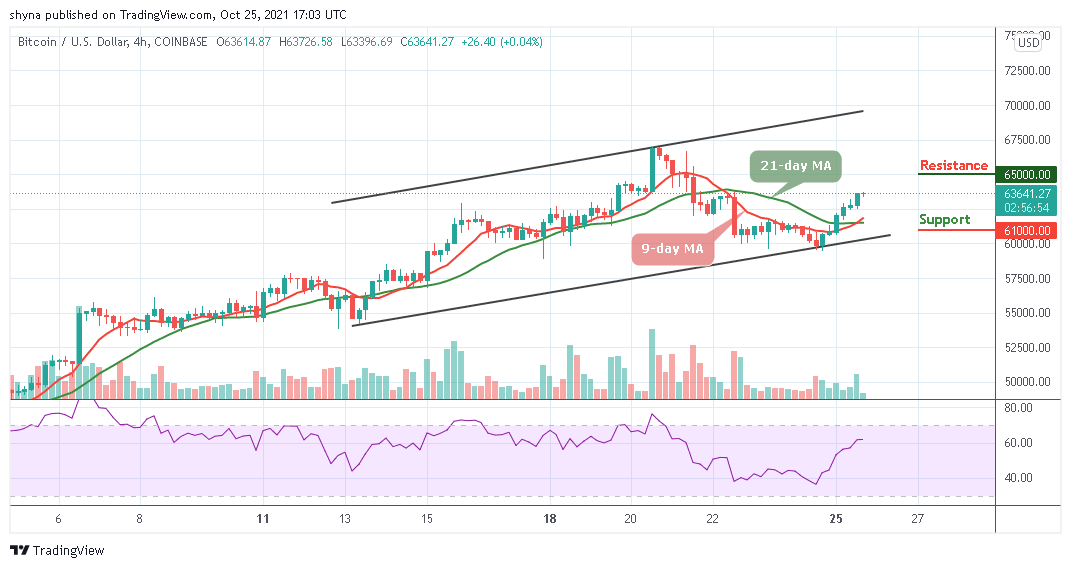
However, considering the recent sharp rebound, the Bitcoin price may re-enter the bullish rally to $64,000 resistance. A climb above the mentioned resistance may further push BTC price to the resistance level of $65,000 and above. However, the technical indicator Relative Strength Index (14) moves above 60-level, suggesting upward movement.
Looking to buy or trade Bitcoin (BTC) now? Invest at eToro!
68% of retail investor accounts lose money when trading CFDs with this provider
Read more: