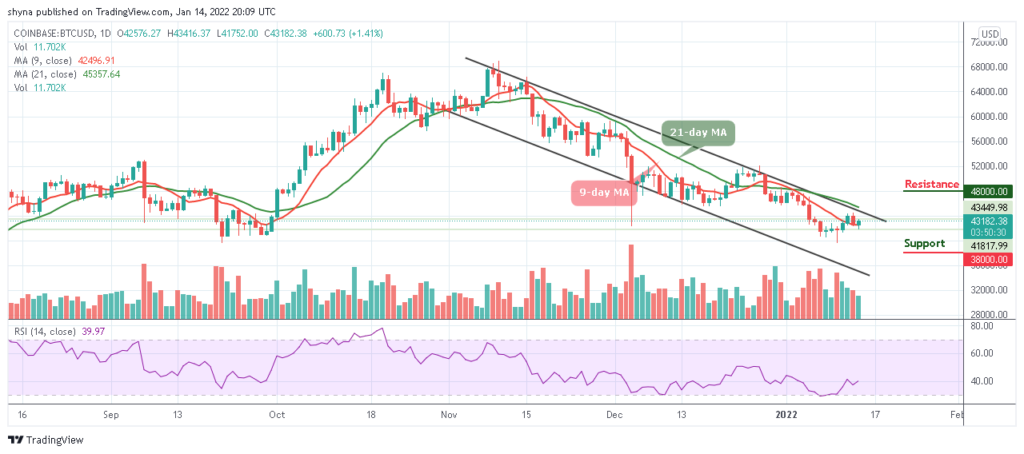
BTC/USD Price Touches $43,416 Level
Bitcoin Price Prediction – January 14
As the daily chart reveals, the Bitcoin price shows that BTC is trading near the resistance level of $44,000 as the recovery comes slowly.
BTC/USD Long-term Trend: Bearish (Daily Chart)
Key levels:
Resistance Levels: $48,000, $50,000, $52,000

Support Levels: $38,000, $36,000, $34,000
At the time of writing, BTC/USD is seen trading at $43,182 after soaring to $43,416 in the early hour of today’s trading. The first digital asset is also seen pulling back to where it is currently trading and may likely head downwards if the bears drag the price back below the 9-day moving average.
Bitcoin Price Prediction: Is Bitcoin (BTC) Ready for the Upside?
On the bullish side, it is important for bulls to keep pushing the Bitcoin price above the 9-day moving average in other to cross above the upper boundary of the channel, otherwise, there may come a bearish breakdown when BTCUSD falls below that barrier. The 9-day MA is likely to cross above the 21-day MA as the technical indicator Relative Strength Index (14) is preparing to cross above 40-level where an oscillation to the higher boundary may confirm the proper trend which is more likely a bullish trend at the time of the outcome.
However, BTC/USD may need to confirm the bullish trend if the market price moves above the previous high of $44,000. On the contrary, the Bitcoin price may follow the bearish trend if the price moves toward the lower boundary of the channel. Should this happen, the king coin may drop to the critical supports of $38,000, $36,000, and $34,000. As the technical indicator Relative Strength Index (14) heads to the upside, a strong bullish spike may push the price towards the resistance levels of $48,000, $50,000, and $52,000.

BTC/USD Medium-Term Trend: Ranging (4H Chart)
According to the 4-hour chart, BTC is moving sideways as the market is likely to fall below the 9-day and 21-day moving averages. However, the intraday trading is yet to disclose the exact direction it’s going to take; following the recent rebound at $41,752 which is now a key support level. The next key support level is $41,800 and below.
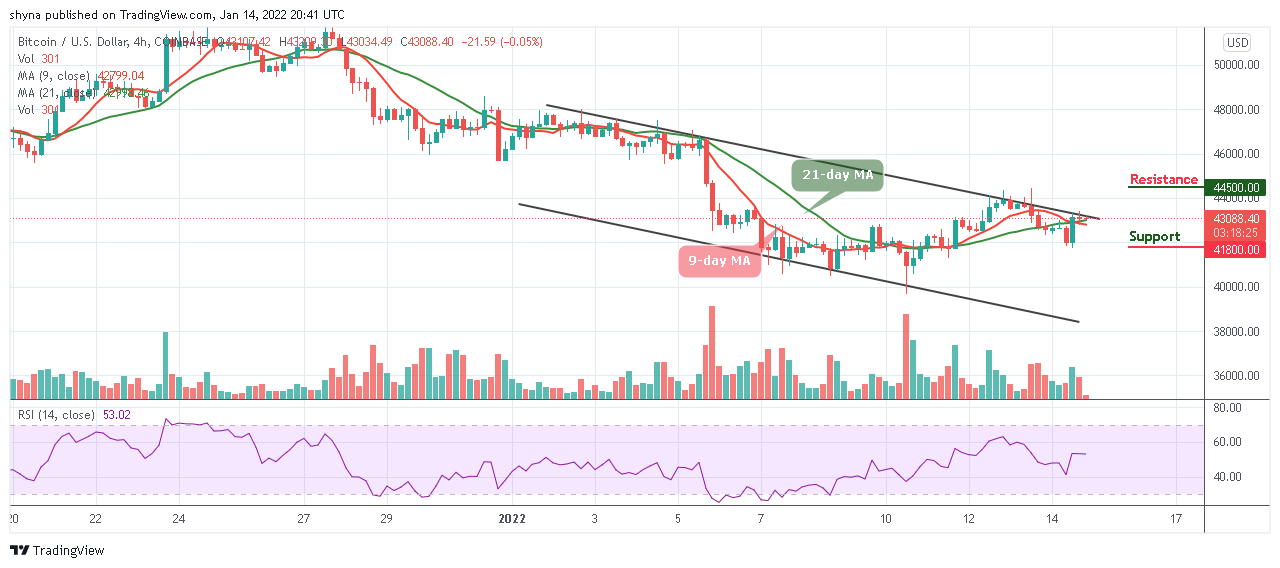
However, considering the recent sharp rebound, the Bitcoin price may continue the bullish rally to $44,000 resistance. A climb above this level may further push BTC price to the resistance level of $44,500 and above as the technical indicator Relative Strength Index (14) moves in the same direction, suggesting sideways movement for the market.
Looking to buy or trade Bitcoin (BTC) now? Invest at eToro!
68% of retail investor accounts lose money when trading CFDs with this provider
Read more: