
BTC/USD Couldn’t Accelerate Above $51,000 Resistance

Bitcoin Price Prediction – December 8
The Bitcoin price prediction is recovering from the recent low of $48,650 but bulls may have trouble taking the market price above $52,000.
BTC/USD Long-term Trend: Ranging (Daily Chart)
Key levels:
Resistance Levels: $55,000, $57,000, $59,000

Support Levels: $45,000, $43,000, $41,000
At the time of writing, BTC/USD is trading down by 0.15% at its current price of $50,552. This is the spot where the coin has been trading for the past few days, with the selling pressure seen in the $50,000 region proving significant. Moreover, where the coin may go next could depend on whether or not bulls can take control of it before it breaks below $50,000 or $48,000.
Bitcoin Price Prediction: Bitcoin (BTC) May Recover Above $52k
On the upside, the Bitcoin price is likely to face sellers near the $48,000 zone. A clear close below the lower boundary of the channel could most likely start a strong selling pressure. Meanwhile, the next target for the bulls could be $52,000 in the near term. Any more gains could lead the price towards the $55,000, $57,000, and $59,000 resistance levels.

However, if Bitcoin fails to clear the $51,000 resistance, it could correct lower. The first key support could be located around the $48,000 level. The main support is near the trend line and $46,000. Any more losses might call for a test of the $45,000 support level. If the bulls fail to defend the $43,000 support zone, the price is likely to dive towards the $41,000 support in the coming sessions.
BTC/USD Medium-Term Trend: Ranging (4H Chart)
On the 4-Hour chart, BTC price hovers around $50,641 and may take time to persistently trade above $51,000. However, if the bulls gather enough strength and regroup, the upward movement may be able to cross above the upper boundary of the channel to hit the $54,000 resistance level.
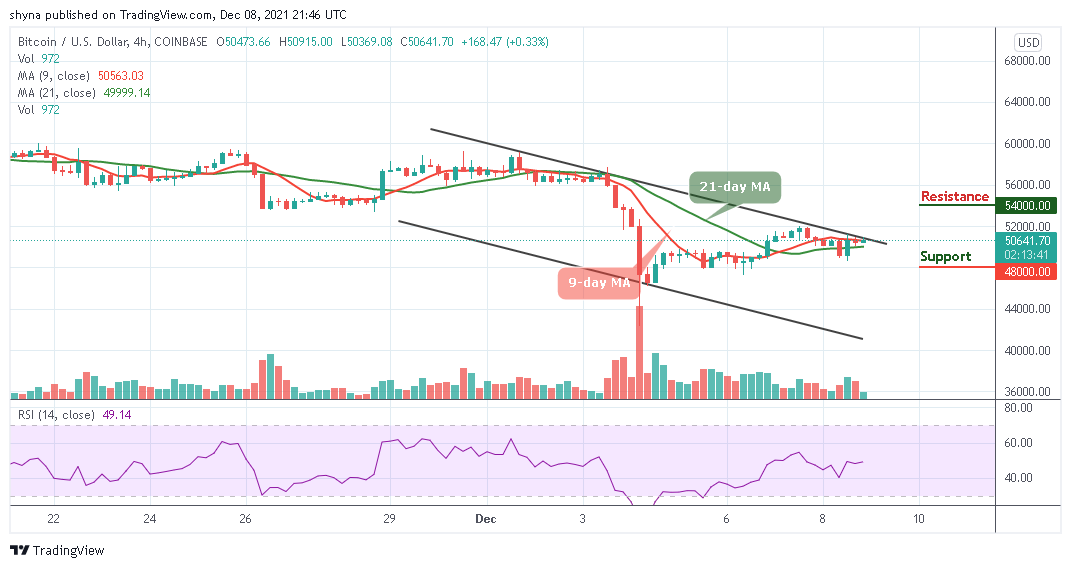
On the downside, immediate support is below the 9-day and 21-day moving averages while the main support is at the $49,000 level. The price may likely fall below $48,000 if the bears step back into the market, a further movement could test the critical support at the $46,000 level. Technically, Bitcoin is currently moving in sideways as the technical indicator Relative Strength Index (14) moves around 50-level, indicating that the market may follow the bullish movement.
Looking to buy or trade Bitcoin (BTC) now? Invest at eToro!
68% of retail investor accounts lose money when trading CFDs with this provider