Bitcoin (BTC/USD) Price Lowers, Averaging $45,000 Support Level
Bitcoin Price Prediction – December 11The BTC/USD financial book has had it that the crypto’s price lowers, averaging $45,000 support line. The market is currently witnessing an estimated valuation at around $48,423 to keep a percentage rate of about 2.37.
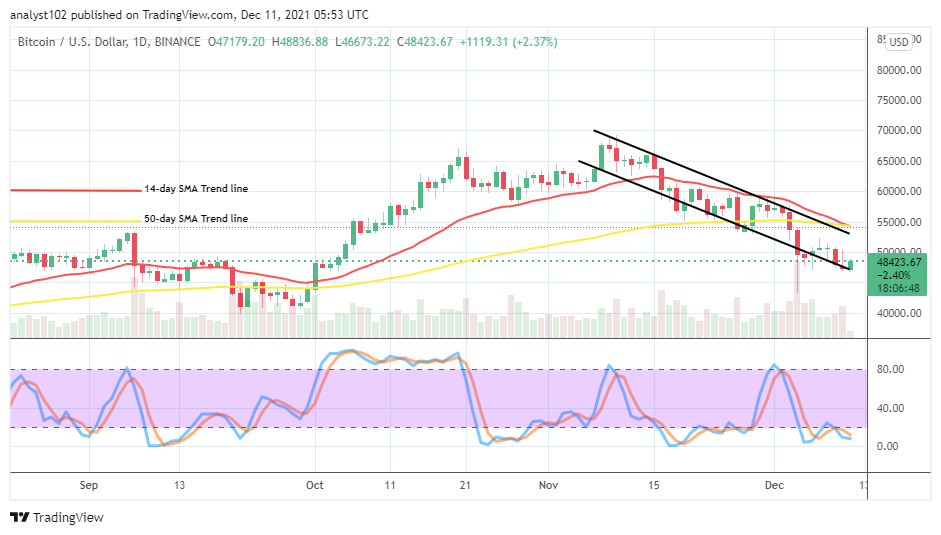
BTC/USD Market Key Levels:Resistance levels: $52,500, $55,000, $57,500Support levels: $45,000, $42,500, $40,000BTC/USD – Daily ChartThe BTC/USD daily chart showcases that the crypto’s price lowers, averaging $45,000 support level as the business operation continues to move in a correction in the bearish channel trend lines. The 14-day SMA trend line has bent southward to touch the 50-day SMA trend line at $55,000. The Stochastic Oscillators have, over time, been consolidating around the range of 20, so much involving the oversold region. That signifies that the market is somewhat responsive to depression until the present.
Will the BTC/USD market still elongate in a correction motion as the crypto-economic price lowers, averaging $45,000 support?
At this point, it is still somewhat dicey to suggest the definite direction that the BTC/USD market may push into as the crypto-economic price lowers, averaging a $45,000 support level. The market, as of writing, experiences a process of making a bullish candlestick to indicate a return of an upward motion. A low-active down-pull tends to make the trade get repositioned to energize the movement back to the upside.
On the downside of the technical analysis, the market resistance trading level at $50,000 remains solidly to portend a barrier zone against smooth runs to the north side. Traders intending to continue to go more shorts on this market have to take note of a rejection possibility around the upper bearish trend line to observe healthier decent sell order positions. The $45,000 trading may not easily breach southward sustainably afterward.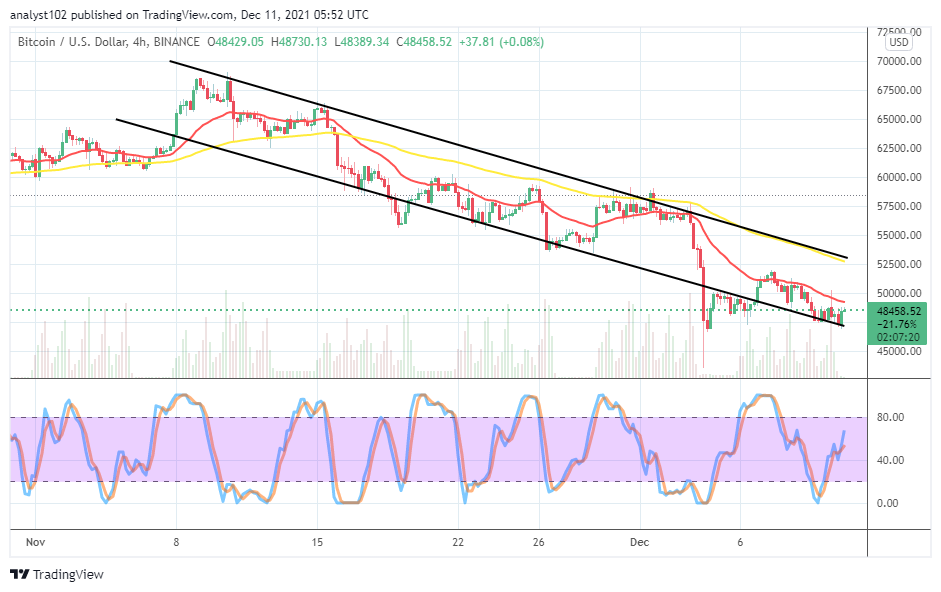

BTC/USD 4-hour Chart
The BTC/USD 4-hour chart also reveals that the crypto-economic price lowers, averaging a $45,000 support level. So many trading activities have taken place around $52,500, $50,000, and $47,500. A bullish candlestick is presently signifying an upswing after touching the lowest value line. The 14-day SMA indicator bends southward, closely above the Japanese trading candlestick beneath the 50-day SMA indicator. The Stochastic Oscillators have stretched the lines close underneath the range of 80. That suggests that the market is relatively pushing for recovery.
Looking to buy or trade Bitcoin (BTC) now? Invest at eToro!

68% of retail investor accounts lose money when trading CFDs with this provider.
Read more: